7 Game-Changing Features of the Data Wrangler Notebook Results Table You Need to Know
If you've ever found yourself rewriting the last line of a notebook cell just to get a quick overview of your data, you're not alone. In VS Code, the default output for Pandas DataFrames is often a static, truncated HTML table that fails to answer essential questions like: Do we have rogue blank values? Are the columns unique? What are the data types? How many times does a specific value appear? What are the last 10 items in a 30k list? The Data Wrangler extension for VS Code transforms this experience with an interactive, feature-rich table that integrates seamlessly into your notebook workflow. Here are seven features that make it indispensable for data exploration and preparation.
1. Seamless Integration with Notebooks
The new experience automatically replaces the static HTML output of Pandas DataFrames with an interactive table—no extra steps required. As long as the Data Wrangler extension is installed, any DataFrame output in a Jupyter notebook cell gets enhanced instantly. You don’t need to modify your code or run additional commands; simply execute your cell as usual, and the interactive table appears. This frictionless integration means you can start exploring data without any learning curve. The transformation applies only where appropriate, so you still get standard output for other objects. It’s a drop-in upgrade that respects your existing workflow.
2. Interactive Sorting and Filtering Without Code
Gone are the days of writing Python code to sort or filter a DataFrame. With Data Wrangler, you can click column headers to sort ascending or descending, and use built-in controls to filter rows based on conditions. This interactivity lets you quickly answer questions like “Which rows have the highest values?” or “Show only entries where a column equals X.” The changes are reflected instantly in the table, and you can reset or modify filters on the fly. This feature dramatically speeds up exploratory data analysis, especially when you’re iterating on hypotheses. It’s intuitive enough for beginners yet powerful for experienced users who want to avoid boilerplate code.
3. Auto-Detection of Missing and Distinct Values
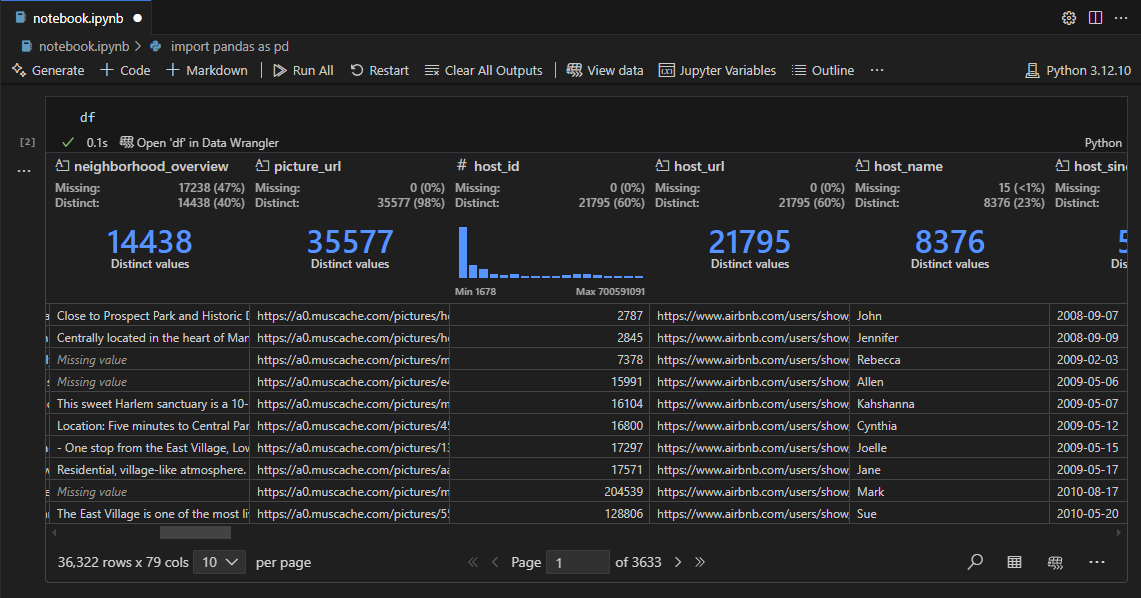
Data quality checks are often tedious and error-prone. Data Wrangler simplifies them by automatically detecting missing (blank) values and highlighting them in the column header. A quick glance tells you if a column contains nulls or unexpected repeating values. Additionally, the extension shows the number of distinct values, helping you assess uniqueness without running df['col'].nunique(). This instant feedback is invaluable for catching data issues early—before they affect downstream analysis. For example, if a column you plan to use as a key has duplicates, you’ll see it immediately. No more guessing or writing extra debug cells.
4. Deep Data Insights at Your Fingertips
Beyond basic stats, Data Wrangler provides rich summaries, histograms, frequency counts, and other statistical insights—all within the notebook cell context. Hover over a column to see its data type, min/max, mean, standard deviation, and more. For categorical columns, you get a bar chart of value counts. These visual and numeric summaries help you understand distributions, spot outliers, and identify patterns without leaving your notebook. You can also view frequency tables for any column with just a click. This feature turns the static table into a living dashboard, making data profiling effortless.
5. Full View Mode with Copilot Integration
When you need more advanced operations, click the “Full View” button to launch the complete Data Wrangler interface. Here you can perform complex data cleaning tasks—like splitting columns, handling missing values, or applying custom transformations—using a visual editor or Copilot-powered suggestions. Copilot can generate data cleaning code based on your intent, saving time and reducing errors. After finishing, a single click returns you to your notebook, where the cleaned DataFrame is ready for further analysis. This seamless back-and-forth between notebook and full view keeps your flow uninterrupted.

6. Export as CSV or Parquet
Once you’ve explored and cleaned your data, you often need to save it for sharing or pipeline feeding. Data Wrangler lets you export the current DataFrame directly to CSV or Parquet files with one click. No need to write df.to_csv() or remember file paths—just choose the format and location. This feature is especially useful when you want to preserve the transformed state of your data after interactively manipulating it. Exports are fast and respect any filters or changes you applied, ensuring consistency between your analysis and output.
7. Getting Started Today
To try Data Wrangler, install the free Data Wrangler extension for VS Code. Then, run any Pandas DataFrame in a Jupyter notebook inside VS Code—the interactive table will appear automatically. Even a simple df cell yields the enhanced experience. No configuration or code changes are needed. As the team continues to iterate, they welcome feedback on the GitHub repository. Start exploring your data more intuitively today and see how Data Wrangler elevates your data science workflow.
Data Wrangler transforms the way you interact with Pandas DataFrames in VS Code notebooks. From instant sorting and filtering to deep statistical insights and seamless export, these seven features address the pain points of static HTML output. The extension is free, requires no code changes, and integrates Copilot for advanced cleaning. Whether you’re a data scientist, analyst, or student, this tool helps you ask and answer questions faster. Install it now and experience a more intuitive way to work with your data.